Team capacity
Planned-vs-actual hours, utilization zones and a run-rate forecast for the team.
The audit tab has two analytics sub-tabs: Activity (the audit-log donut, see Audit log) and Team capacity. The capacity tab compares each member's logged hours against their expected hours (from the working-hours & holidays baseline) for the same date range or sprint the audit table is showing, and gives a team-level roll-up plus a run-rate forecast.
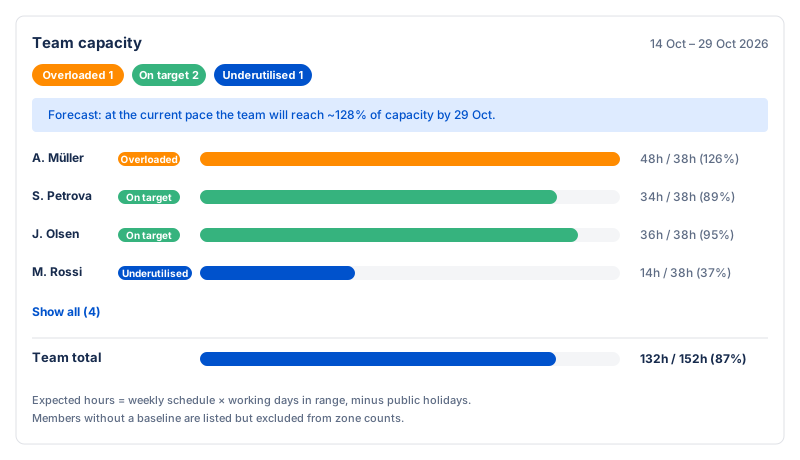
What you see
- Per-member rows — the member name, a utilization
zone lozenge, a bar showing logged vs. expected hours, and
a numeric label
Xh / Yh (Z%). Rows are sorted most-logged first; the list collapses to the top 5 with a Show all toggle for larger teams. - Team-total row — the summed expected and logged hours for the whole team, with the overall utilization percentage.
- Zone counts — lozenges showing how many members are over target, on target, or underutilised.
- Forecast — when the range end is in the future and there's at least one working day left, a run-rate forecast estimates where the team will land by the end of the range based on the logged-so-far pace.
Utilization zones
| Zone | Range | Lozenge |
|---|---|---|
| Overloaded | > 100% | overloaded |
| On target | 90%–100% | on target |
| Underutilised | < 90% (with a baseline set) | underutilised |
Sprint mode
In sprint mode, the sprint's startDate–endDate
is the capacity window (a sprint has a real date range, which is
exactly what the working-days math needs). Only time logged inside the
sprint window counts; time logged on the sprint's issues outside the
window doesn't inflate the sprint capacity. The capacity card stays in
sync with the audit filter — the auditor's member filter selection is
applied, so the card computes for the same people the table shows.