Audit view
The auditor's team-wide view: filter, sort, flag, and export.
The audit view is what users with the Time Auditor permission (or site admins) see when they open the Fairlog tab. It shows worklogs and internal-activity entries for the whole team in a flat, sortable table, with flags on entries that look suspicious.
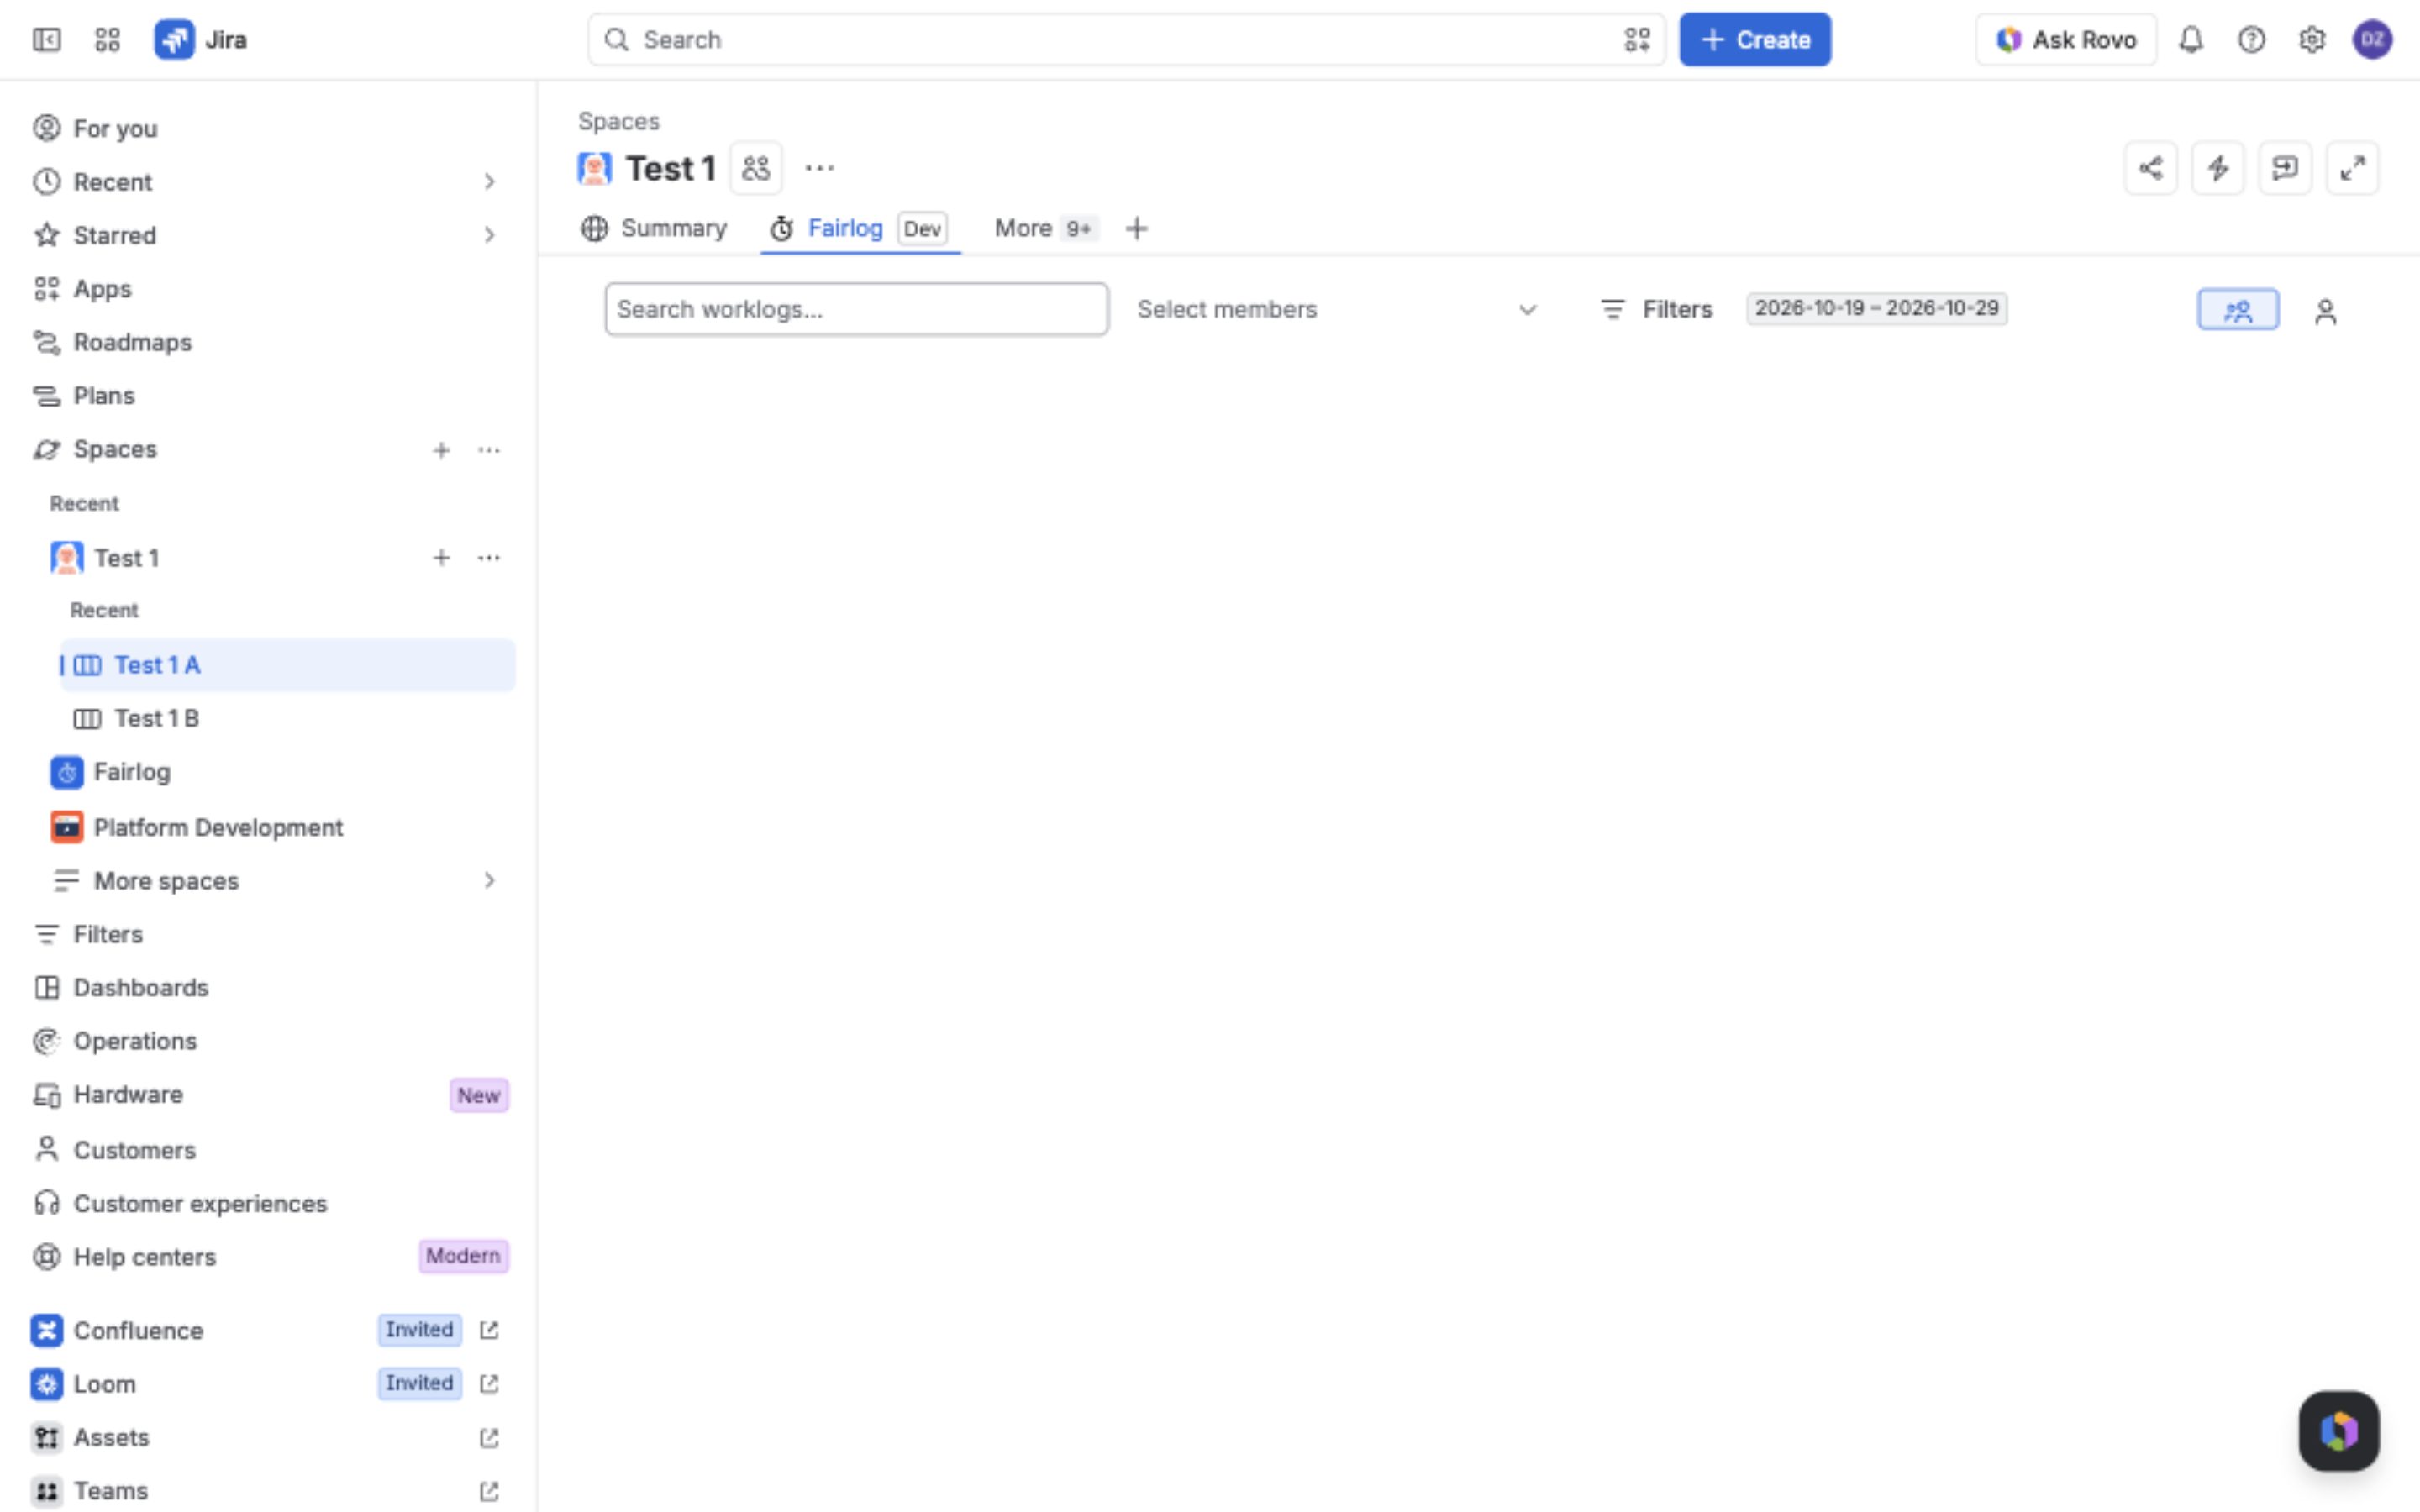
Filter bar
- Date range — pick a From and To date, or switch to sprint mode (next option).
- Sprint — choose a Scrum sprint from the dropdown. The sprint's active start/end dates are used automatically; freshly-added issues appear immediately (Fairlog reads sprint membership directly, not the laggy search index).
- Member filter — for teams of 6 or fewer members, the filter shows round clickable avatars; click one to narrow the table to that person, click again to clear. For larger teams, the filter is a standard multi-select dropdown.
The table
Columns in the audit view:
| Column | What it shows |
|---|---|
| Issue | The issue key (e.g. PROJ-123), linking to the issue
in Jira. Internal-activity entries show the category name in a
coloured lozenge instead of an issue key. |
| Work started | The entry's started timestamp — the date/time the
work was claimed to happen. |
| Hours | The time spent, in hours (converted from
timeSpentSeconds). |
| Worker | The display name of the user who logged the work. (Auditor-only column — non-auditors never see this.) |
| Flags | Lozenges for each triggered suspicion rule (see Flags). Hover any lozenge to see the detail in a tooltip. (Auditor-only column.) |
| Logged at | The entry's created timestamp — when the entry was
actually added. The gap between "Work started" and "Logged at"
is what the GAP
flag catches. |
The table is flat — no grouping. Click any column header to sort ascending or descending. The sort is client-side after the data is loaded.
Flags
Each flag is a colored lozenge in the Flags column:
GAP BATCH STATUS EST SHORT DUP OUTLIER LIMIT
See the Flags page for what each one catches, how it's detected, and the defaults.
Analytics tabs
The Activity tab shows a donut of recent worklog and internal-entry mutations grouped by editor, with a clickable legend that drills into each editor's events (see Audit log). The Team capacity tab compares each member's logged hours against their expected hours for the same window, with utilization zones and a run-rate forecast (see Team capacity). Both tabs follow the audit filter: sprint id and the selected members are passed through.
Export
The three-dots menu offers three exports:
- Export to CSV — the filtered worklogs as CSV via a short-lived, single-use download token (see My Time for the token pattern).
- Export audit log (CSV) — the audit-log mutations for the project and date range as CSV. Auditors only (see Audit log).
- Export to PDF — a signed timesheet of the caller's own time for the current filter (see PDF export).